
?Data-driven talent acquisition teams are more likely to be successful than organizations hiring blindly. But just having access to silos of disorganized data from many disparate sources may not help recruiters hit their hiring goals. Enter recruiting dashboards.
“A dashboard is a collection of information—one place where you can see everything and understand your performance as a recruiter and the performance of your recruiting team,” said Michelle Yoshihara, manager of talent planning at Greenhouse, a recruiting software company in New York City. Tracking talent acquisition metrics is a major part of her role.
“With dashboards, recruiters don’t have to search through all the different data reports coming from the [applicant tracking system] or the sourcing system or other places,” she said.
Jeff Beckham, head of product marketing at Gem, a talent engagement platform in San Francisco, said that a recruiting dashboard is a central place to keep track of key recruiting metrics, in order to visualize trends, gather insights, spot bottlenecks and optimize the recruiting process.
“Dashboards essentially provide transparency into recruiting operations—they’re not just valued by the recruiting team but all the way up to any CEO that cares about hiring,” he said. “The leaders that want to know ‘Is hiring efficient?’ ‘Is it predictable?’ ‘Is it equitable?’ “
Recruitment dashboards are designed and built for those without a data analysis background, to offer instant insights to common recruitment issues. They can be created using business software tools or purchased as part of a variety of recruiting software.
Yoshihara said the consumers of recruiting dashboards typically fall into two distinct profiles: recruiters and business leaders.
“Recruiters want to evaluate the health of the searches they are running,” she said. “Are inputs leading to good leads or are there areas which can be improved?”
A recruiting team lead can look at metrics to gauge team performance, she said. “For example, if the team is having trouble with the sourcing conversion rate, but everything else is going well, you could invest in a workshop on sourcing strategies.”
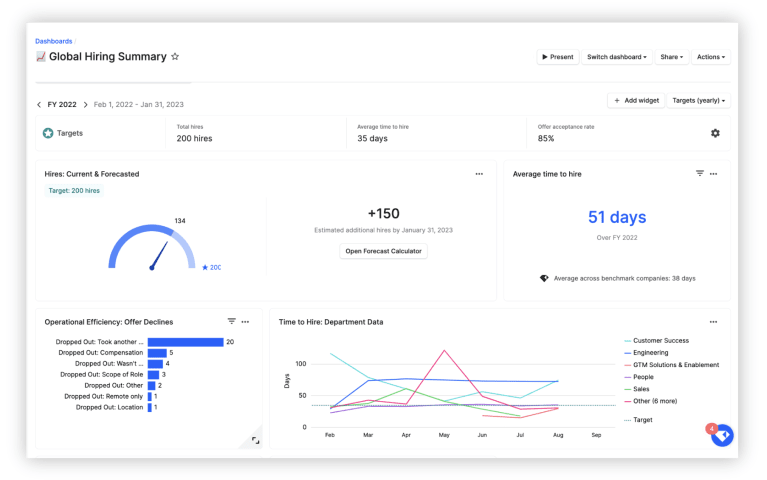
Yoshihara said that leaders tend to want a high-level view of the organization’s recruiting and hiring metrics and visualized progress toward organizational goals. “For example, if a department head sees that the offer acceptance rate for the department is not meeting expectations, he or she may want to check into rejection reasons and take actions to get the process on track. The power of performance data insights comes from the action you take once you understand the metrics.”
Metrics to Measure
There are several common types of dashboards that can be created and a countless variety of metrics that can be tracked in each. Dashboards can be set up to measure just one part of the hiring funnel, like sourcing or interviewing, or certain programs like college recruiting or diversity hiring. The most-tracked metrics for recruiting teams are time-to-hire, cost-per-hire, and retention rate, according to a 2019 survey by Yello.
“Most companies have dozens of dashboards,” Beckham said. There’s usually an executive dashboard, created specifically for leadership, and dashboards aimed at overall visibility into hiring progress and goals as well as recruiting performance of individuals, teams and business units, he said.
“Recruiters are interested in the nitty gritty,” Yoshihara said. “They want to see the sourcing conversion rate, for example, to better understand how their messaging resonates with the market.”
She added that recruiters are interested in pipeline conversion rates overall to see where any breakdowns in the process are occurring, and they are especially interested in the offer acceptance rate to better comprehend the hiring manager’s role in the process.
Leaders, on the other hand, are concerned with cost metrics, she said. “Cost-per-hire is a hot topic, especially during times of economic uncertainties. Business leaders want to measure the time investment in recruiting and hiring and try to understand how long it takes to fill a position. If it’s discovered that a team is spending an excess amount of time interviewing, for example, and those interviews don’t lead to hires, that’s a big concern.”
Metrics related to diversity have recently gained a lot of attention, Beckham said. “Especially from companies that made public commitments to diversity, they are tracking progress. Are they reaching out to diverse talent pools, are those candidates moving through the process, are hires being made?”
Create Your Own Dashboards
Beckham said the first thing talent acquisition leaders need to do when creating recruiting dashboards is decide on the utility of the dashboard and which metrics matter most to them.
“Once the metrics to prioritize are determined, you need to collect and compile the data, which can be challenging without automated technology,” he said.
For smaller recruiting functions, it is possible to use spreadsheet programs like Microsoft Excel or Google Sheets to create dashboards. “If the metric is something simple, like how many hires have been made, you can export that to an Excel sheet and create a chart from it,” Beckham said.
[SHRM members-only resources: Time-to-Hire/Time-to-Fill Calculation Spreadsheet and Recruiting Yield Ratios Spreadsheet]
“More complicated metrics need more data from different places, and that data needs to be unified and formatted,” Beckham added. “If it’s being done manually, it’s typically done by data analysts combing data warehouses and creating visualizations with software like Tableau. It is doable—but labor- and time-intensive and requires an advanced skill set.”
The easiest way to set up and use recruiting dashboards is through recruiting technology vendors like applicant tracking systems and candidate relationship management systems, many of which offer easy-to-build, customizable, self-service dashboards made from starter templates. Recruiters can add and remove widgets without having data analysis expertise, and the dashboards stay up-to-date, without having to be manually updated.
The only caveat is that the software must be able to integrate with the organization’s other HR systems.
When designing dashboards, keep the following tips in mind:
- Make it visual. A collection of data tables is not as appealing—therefore less actionable—than visual elements such as vibrant charts and graphs.
- Keep it simple. Do not include every piece of data available. Be intentional in what is displayed and how it is displayed. The design should emphasize both presentation and utility.
- Ensure accuracy. “The information you’re seeing in your dashboard is only as good as the information you input into it,” Yoshihara said. “A big challenge is data accuracy. We conduct regular data quality audits to ensure that the information we’re sharing is accurate. The effectiveness of the actions made from the data depend on it.”
